So last week our Cornwell distributor came by and one of the items he had that week was this Creader VI scanner by LAUNCH. it cost about 200 dollars and isn't bad for the price. keep in mind iv been spoiled my whole career with GM's TechII so im a little bias.

its capable of reading basic codes and quiet a few manufacturing specific codes too. as long as the vehicle has OBD II then this code reader should work. found it extremely fast and is perfect if you want to check or clear codes. one other great feature is you can RECORD up to 8 HOURS of date. HOWEVER i have not figured out if its possible to use the graph feature with recorded data.

reading and clearing codes isn't all it can do. it also doubles has a decent scanner with graphs and values. the first downside i to this tool i found was its extremely small screen and extremely detailed graphs... too detailed for that matter.
as long as the item you want to graph doesn't change a LOT such as an O2 sensor then you should be able to make decent use of the graph feature. can graph up to 4 items at a time but things quickly become over crowded.
iv tested this quite a bit at work along side a TechII and only once was i unable to rear all the codes from a vehicle.
vehicles iv read/cleared codes or graphed values:
1999 olds alero with a 3.4
2006 chevy malibu with 2.4
2009 chevy HHR with a 2.4
1998 hyundai accel with a turd
2005 chevy silverado with a 6.0
200x kia van
button layout is ok, instructions are to a bare minimum and customer service could be A LOT better.
overall for a DIY'er i think this tool could be a great help for checking things and clearing codes but as a professional it leaves a lot to be desired as a solo tool but could be an aid to your collection (for quick viewing of codes).
here are some pics:

here is the reader, comes with what you see plus a manual and a usb cable to update as updates come available.

as you can see this date stream consist of calculated engine load and rpm. The graph shows every wrinkle in a cats ass but if you look at the scale you can see its not a wide range. scale will self adjust as your graphed items get bigger (such as if i stepped on it and rpms went up to 4k. the graph would re "scale")

Here is just some of the values you can watch. amount of viewable items varies depending on vehicle.

here is an example of items that move too fast and make the small screen hard to read. what i selected was my B1S1 O2 and my B1S2 O2. now picture having all four O2s going at once (if you have 4)

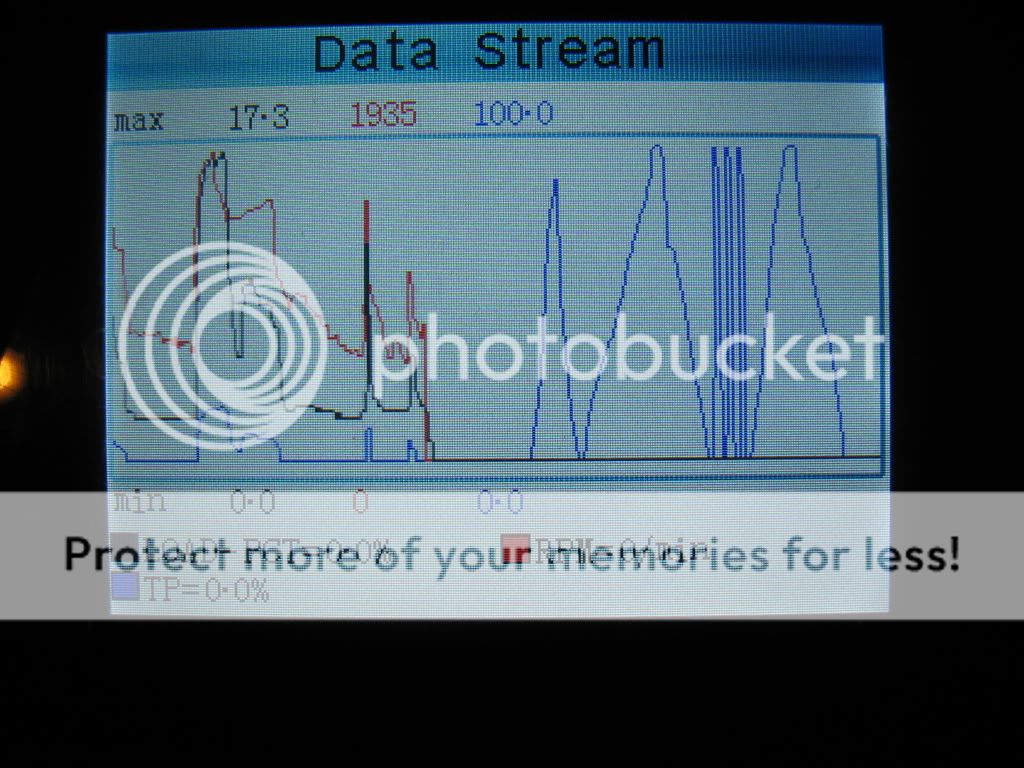
in this graph iv selected engine load, RPMs, and Absolute throttle position. great view of whats happening as i pull a set of double hills at cruise speed with cruise control activated.

i used this picture to demonstrate that zoom feature. this is the "far" setting.

this pic is the same screen but up close.

so this pic represents a cool feature of the graph i think. here i am at my destination. i shut the engine off but turn the key back on. as you can see i slowly push the accelerator pedal to the floor and let back off a bunch of times at different speeds. IF i had a faulty TPS a not so "predictable" pattern would show.
over all i like this. but i have a hard time getting use to a tool that doesn't have all the features of a Tech II. personally... i think its a great tool of anyone on here.